A white background with a few lines on it

Glenda Ward, REALTOR®

Market Trends 43452, Fall 2024

glenda • October 4, 2024

Local Market Trends, Port Clinton, OH: Fall 2024


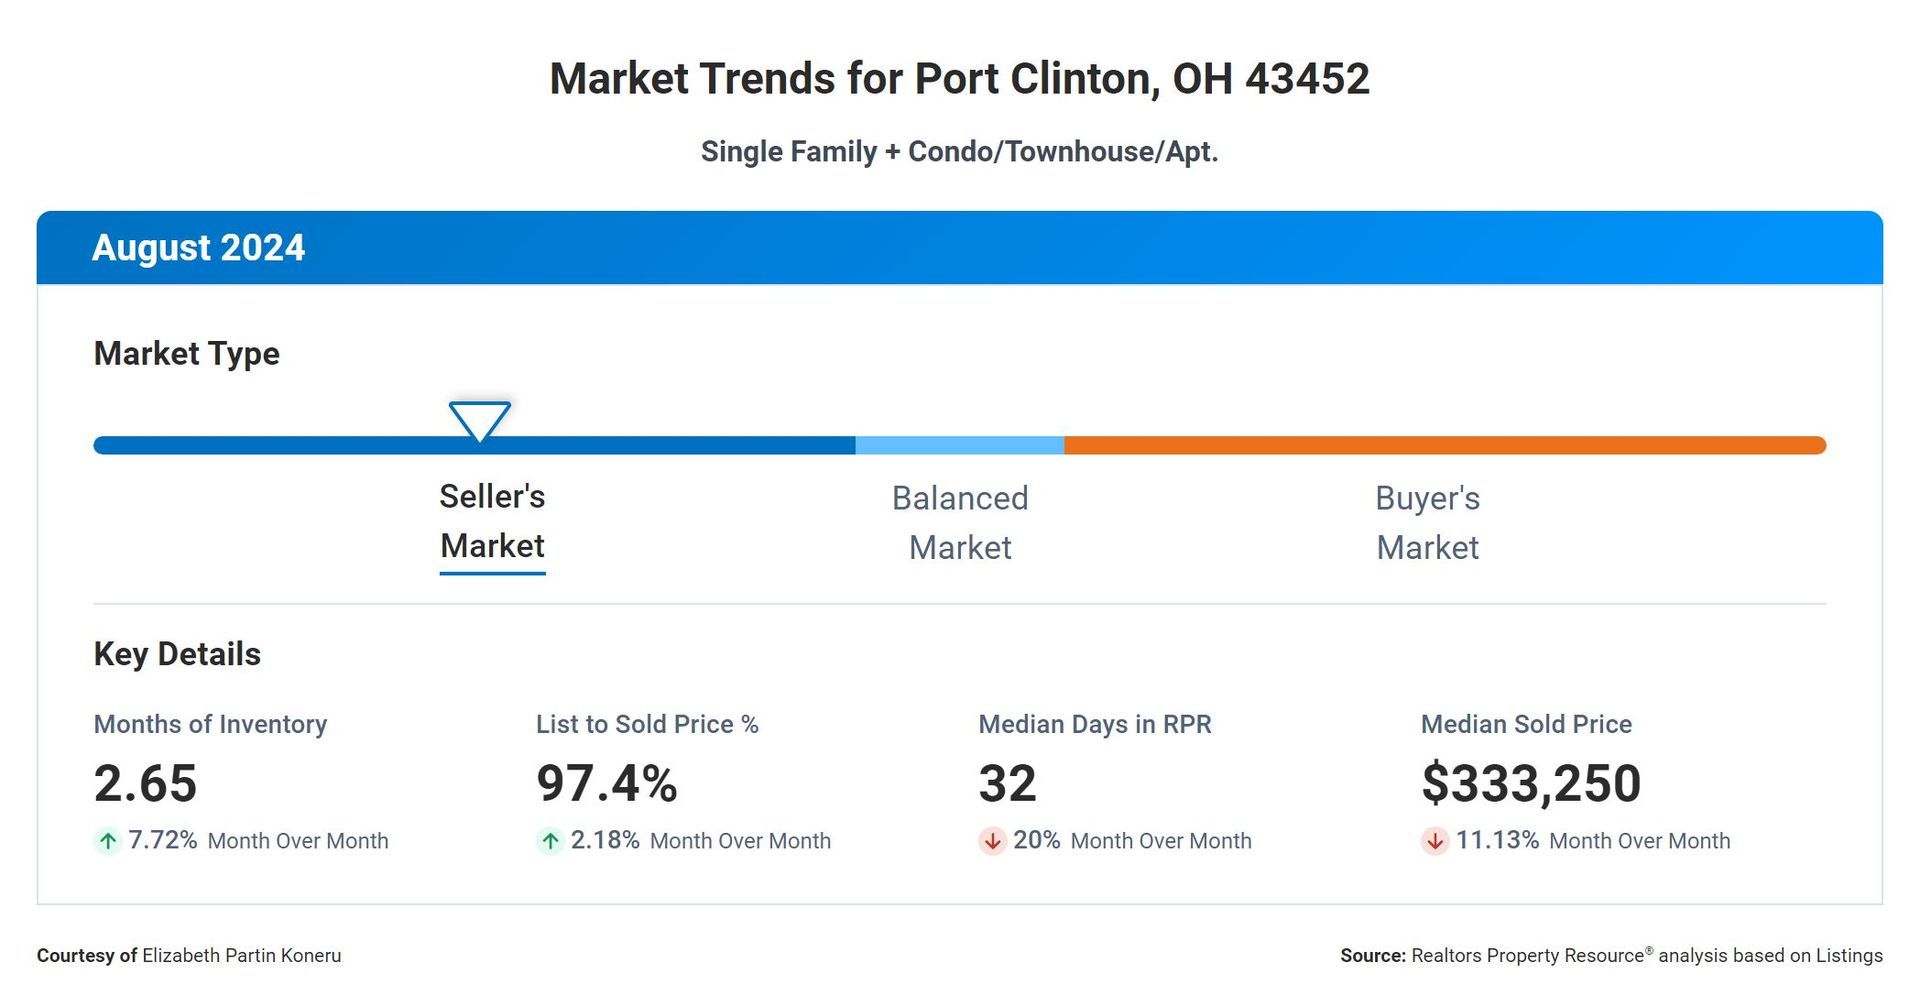
The real estate market is currently experiencing a tight inventory with only 2.65 months supply available. This low inventory level indicates a high demand for homes, which can often lead to increased competition among buyers. 


The 12-month change in months of inventory is -20.42%, showing a significant decrease in the amount of time it takes for homes to sell. This can be attributed to the strong demand in the market and the limited supply of available homes.


Homes are spending a median of 32 days on the market before being sold, indicating a relatively quick turnaround time for sellers. This quick pace can be beneficial for both buyers and sellers, as it allows for efficient transactions to take place.


The list to sold price percentage is 97.4%, showing that sellers are able to sell their homes for close to their asking price. This can be a positive sign for sellers, as it indicates a strong market where buyers are willing to pay the listed price for properties.


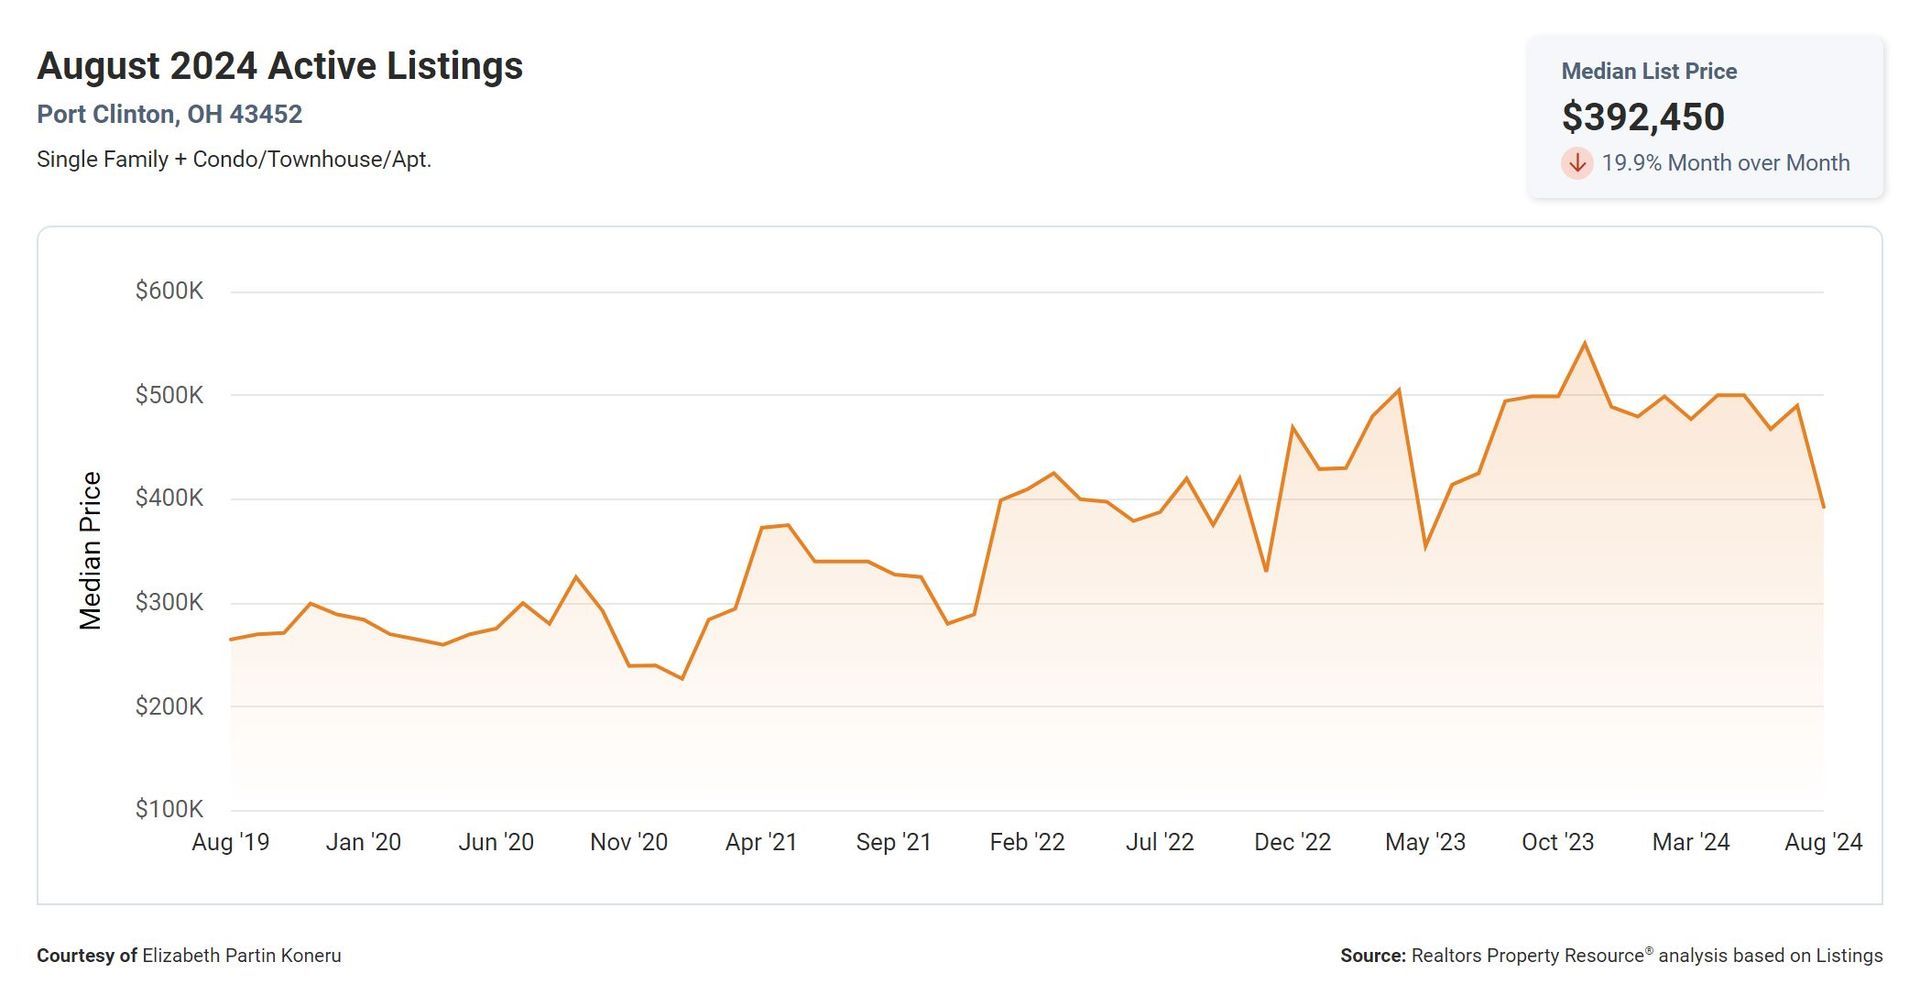
The median sold price in this market is $333,250, reflecting a healthy and stable price range for homes. This can be reassuring for both buyers and sellers, as it indicates a consistent market value for properties.


Overall, these metrics paint a picture of a competitive and active real estate market. Buyers may need to act quickly to secure a property, while sellers may benefit from the strong demand and favorable selling conditions.


Looking to buy or sell anytime soon? Let's Chat, Email Me!

A lighthouse is sitting on the shore of a lake at sunset.

Ready to Buy or Sell? Let's Chat!!!

By glenda June 7, 2024
When it comes to real estate, there are several key metrics that can give us valuable insights into the Port Clinton / Catawba Market. Let's take a closer look at how these metrics correlate and what they mean for both buyers and sellers. First, let's talk about the months supply of inventory, which currently stands at 2.9 4. This metric represents the number of months it would take to sell all the available homes on the market at the current pace of sales. A lower number indicates a seller's market, where demand exceeds supply, resulting in potentially higher prices. Now, let's consider the 12-month change in months of inventory, which has seen a significant increase of 71.93% . This means that compared to the same period last year, the supply of homes has increased, potentially creating a more balanced market. This increase could be due to various factors such as an influx of new listings or a slight decrease in demand. Moving on, the median days homes are on the market is 19 . This metric provides an indication of how quickly homes are selling. A lower number suggests a faster-paced market with high demand and potentially multiple offers on properties. Buyers should be prepared to act swiftly in such a market, while sellers may have an advantage in terms of faster sales. Next, let's look at the list to sold price percentage, which is currently at 96.9% . This metric shows the percentage at which homes are selling compared to their listing price. A higher percentage indicates that sellers are achieving a high percentage of their asking price, which can be a positive sign for sellers. However, buyers should still negotiate and conduct thorough market research to ensure they are getting fair value for their investment. Lastly, the median sold price stands at $270,000 . This represents the middle point of all the sold prices in a given area or market. It gives us a sense of the general price range of homes being sold. Buyers can use this information to gauge their budget and expectations, while sellers can use it as a reference point when setting their listing price. In summary, these real estate metrics provide us with a comprehensive view of the market. The months supply of inventory, the change in months of inventory, the median days homes are on the market, the list to sold price percentage, and the median sold price all work together to give buyers and sellers a better understanding of the current conditions. Whether you're looking to buy or sell, it's essential to keep an eye on these metrics to make informed decisions in the real estate market.
By glenda September 19, 2023
When it comes to real estate, there are several key metrics that can give us valuable insights into the Port Clinton / Catawba Market. Let's take a closer look at how these metrics correlate and what they mean for both buyers and sellers. First, let's talk about the months supply of inventory, which currently stands at 2.9 4. This metric represents the number of months it would take to sell all the available homes on the market at the current pace of sales. A lower number indicates a seller's market, where demand exceeds supply, resulting in potentially higher prices. Now, let's consider the 12-month change in months of inventory, which has seen a significant increase of 71.93% . This means that compared to the same period last year, the supply of homes has increased, potentially creating a more balanced market. This increase could be due to various factors such as an influx of new listings or a slight decrease in demand. Moving on, the median days homes are on the market is 19 . This metric provides an indication of how quickly homes are selling. A lower number suggests a faster-paced market with high demand and potentially multiple offers on properties. Buyers should be prepared to act swiftly in such a market, while sellers may have an advantage in terms of faster sales. Next, let's look at the list to sold price percentage, which is currently at 96.9% . This metric shows the percentage at which homes are selling compared to their listing price. A higher percentage indicates that sellers are achieving a high percentage of their asking price, which can be a positive sign for sellers. However, buyers should still negotiate and conduct thorough market research to ensure they are getting fair value for their investment. Lastly, the median sold price stands at $270,000 . This represents the middle point of all the sold prices in a given area or market. It gives us a sense of the general price range of homes being sold. Buyers can use this information to gauge their budget and expectations, while sellers can use it as a reference point when setting their listing price. In summary, these real estate metrics provide us with a comprehensive view of the market. The months supply of inventory, the change in months of inventory, the median days homes are on the market, the list to sold price percentage, and the median sold price all work together to give buyers and sellers a better understanding of the current conditions. Whether you're looking to buy or sell, it's essential to keep an eye on these metrics to make informed decisions in the real estate market.
More Posts
Share by: